Introduction
This interface is made up of interlocking graphical widgets with predefined tasks which can be put together to create a set of instructions to be executed by the phone using the SEELab hardware.
Get Voltage
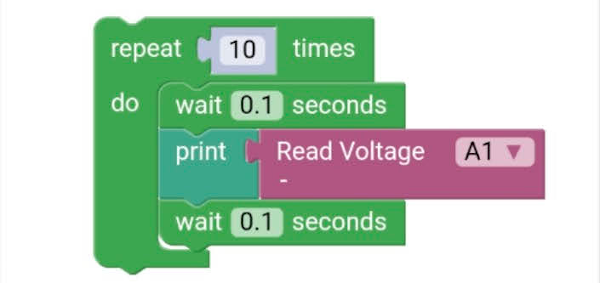
In this demo, you will read a voltage value from A1, and display it on the screen.
For that, the Read Voltage block has been dragged from the ExpEYES toolbox, and added to the workspace.
A Print block from the Text toolbox was also added to the workspace. Then, these two are connected together.
- Click on the Run Code button to view the results
Capture1
The built-in voltmeters in the SEELab3 are very fast, and can measure up to 2 million readings every second. These measurements are made at very precise intervals, and canbe used to study any fluctuations in the input voltage signals.
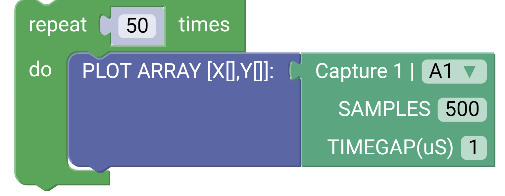
In this demo, you will read 500 voltage values from A1 input, with 1 microsecond between each reading, and plot it as a function of time.
For the input signal, we will use WG which outputs a -3.3 to 3.3 sinusoidal wave with a default frequency of 1000 Hz.
The Capture1 block has been dragged from the ExpEYES toolbox, and attached to a PLOT ARRAY[X[],Y[]] block. This is because capture1 returns
2 arrays. One for time along the xaxis, and the other for the measured voltage values for each time value.
We now place these two blocks inside a repeat 10 times loop to view ten traces one after the other.
More Examples