Introduction
The simple data logger you are already familiar with records any specified input voltage with respect to time, however,
it is often desirable to vary one output parameter, and study the effect on some other aspect of the experiment.
In the advanced data logger, both X and Y can be chosen from the following list
- Inputs
- Time
- Voltmeter: A1,A2,A3,IN1,SEN,AN8,CCS
- Capacitance
- Resistance
- Oscilloscope
- Extracted frequency,phase,amplitude or offset using a sine fit
- Difference in phase between A1(Any analog input) and A2. Also, ratio of amplitudes.
- Frequency on IN2
- Any connected I2C sensor (Magnetometer, accelerometer, temperature, gyro etc)
- Select 1 parameter from any of the detected sensors added automatically to the list
- SR04 distance sensor
- Outputs (Start and End must be specified)
- WG Sine wave generator frequency
- SQ1, SQ2 square wave generator
- PV1, PV2 voltage outputs
Simple Example: PV1 vs Voltmeter
Connect PV1 to A2
[logging]
interval = 50
settling = 10
datapoints = 100
[x-axis]
 tool = pv1
 minimum = 0
 maximum = 3.0
[y-axis]
 tool = voltmeter
 meter = A2
Characterising a piezo buzzer
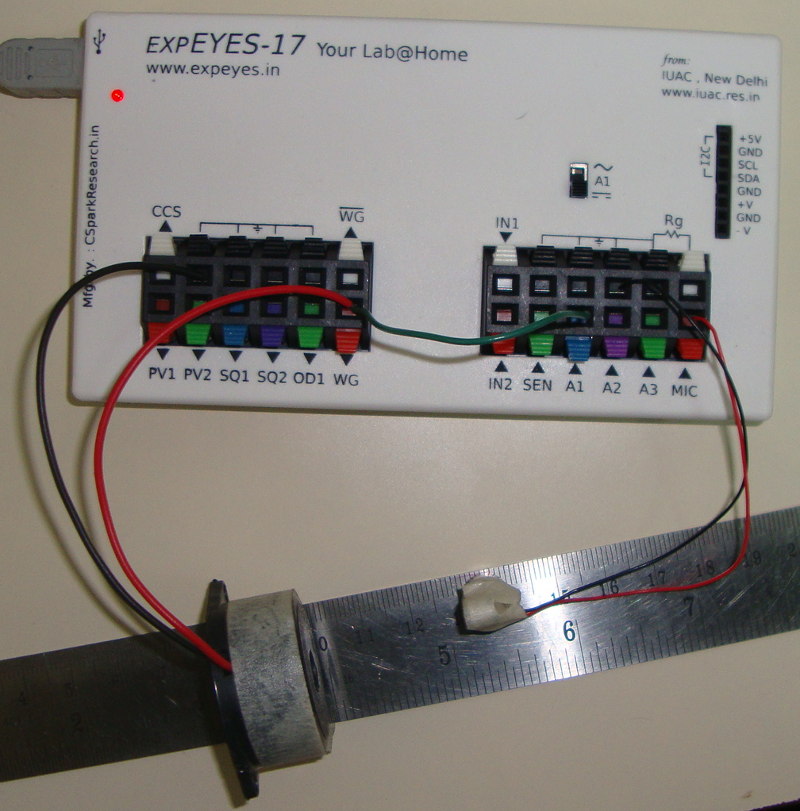
The following configuration will set the X and Y axis for characterising a piezo buzzer.
Y axis is set to oscilloscope, and parameter=1 implies that the first extracted parameter (amplitude) is to be measured.
[logging]
interval = 50
settling = 100
datapoints = 100
[x-axis]
tool = wg
minimum = 2000
maximum = 5000
[y-axis]
tool = oscilloscope
channel = MIC
parameter = 1
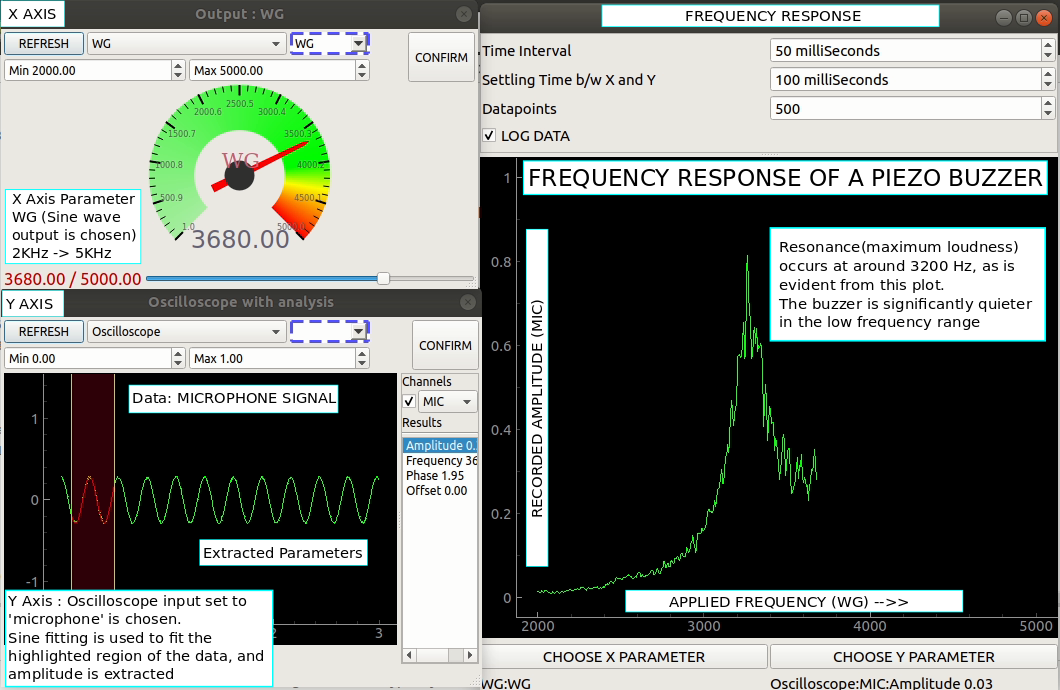
cross-check-frequency
Advanced data logger showing the X parameter set to WG sine generator, and Y parameter(input) as amplitude extracted from microphone channel of the oscilloscope.
Procedure
- The frequency waveform generator WG is connected to a Piezo buzzer.
- X parameter is set to WG. Minimum 2000Hz, Maximum 5000Hz
- A microphone is connected to MIC input
- Y parameter is set to oscilloscope
- Channel is selected as MIC
- Amplitude is selected
- Cross check frequency button is enabled
The logger will measure the microphone signal’s amplitude for N different frequency values supplied to the buzzer, where N can be specified
before enabling the log.
A settling delay of 100mS is set to allow the piezo buzzer to settle into a new frequency before measuring the stable amplitude.
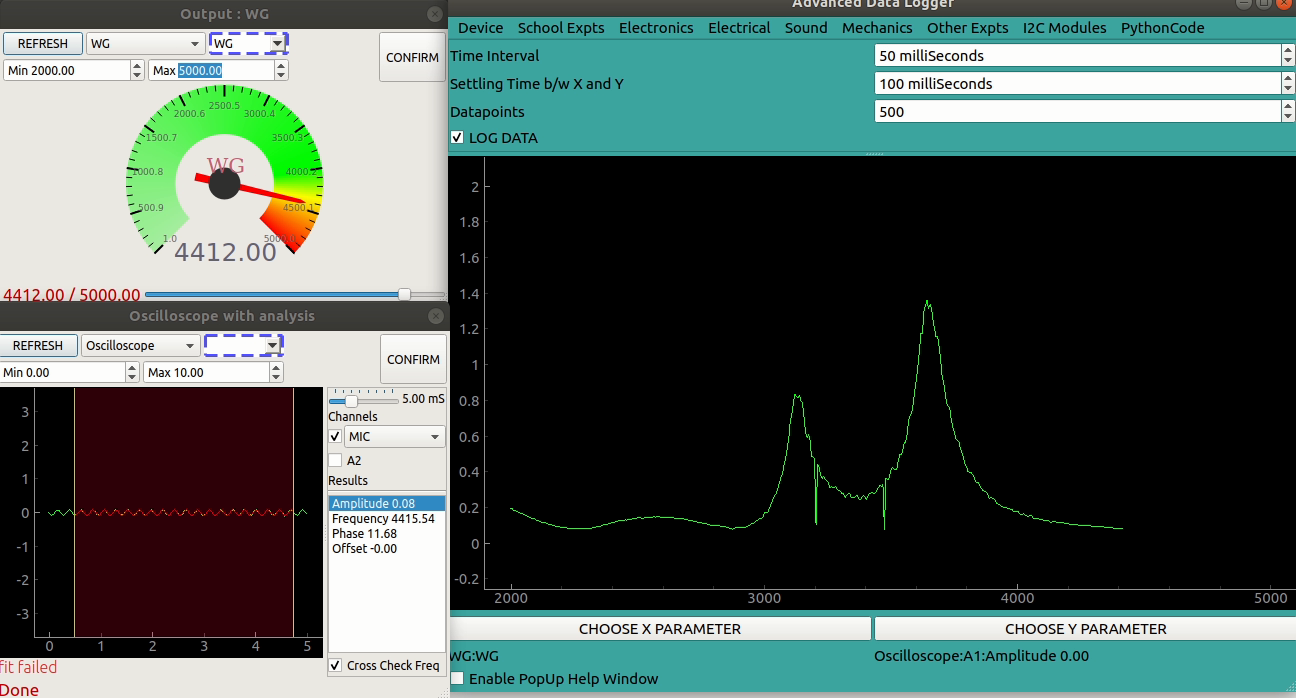
500 datapoints were acquired, and the piezo buzzer was found to have two resonant frequencies.
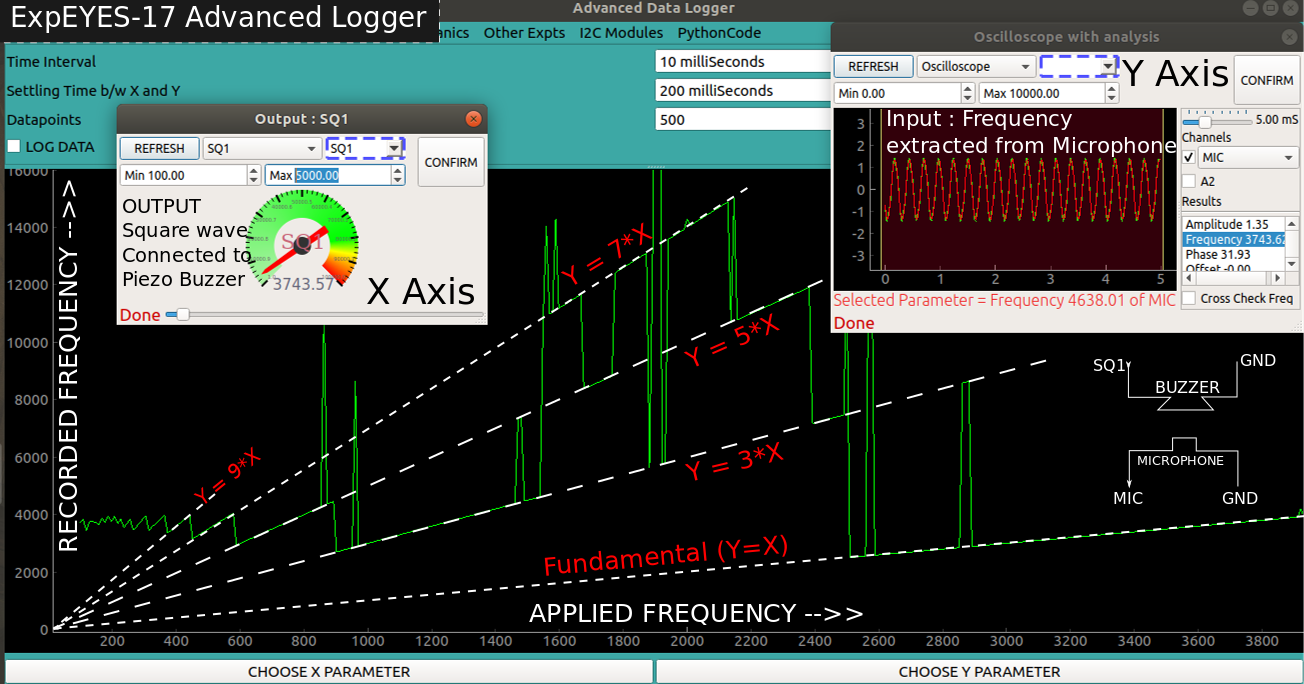
Characterising a piezo buzzer with a square wave
The following configuration will set the X and Y axis for characterising a piezo buzzer.
Y axis is set to oscilloscope, and parameter=1 implies that the first extracted parameter (amplitude) is to be measured.
[logging]
interval = 50
settling = 100
datapoints = 100
[x-axis]
 tool = sq1
 minimum = 300
 maximum = 5000
[y-axis]
 tool = oscilloscope
 channel = MIC
 parameter = 1
 Jithin B.P.