SEELablet

Instrumentation cluster for laboratories

Brief Summary
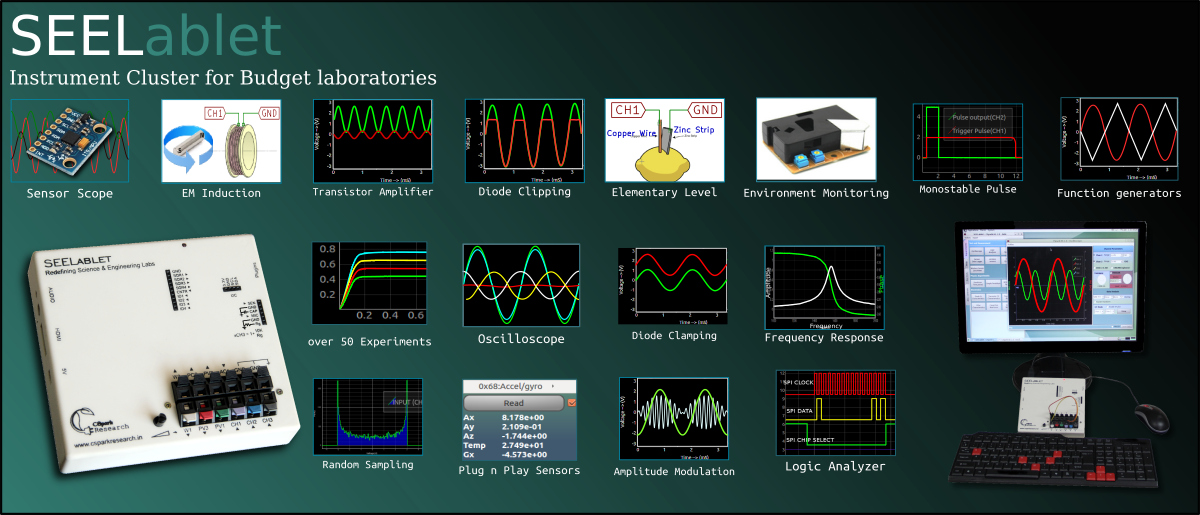
This project aims to equip educators and budding citizen scientists with a flexible range of control and measurement equipment in a compact, standalone form, with minimal BOM.
July 02, 2017
Jithin B.P.

Out of Stock , Please refer to ExpEYES-17

Introduction

A real-time data acquisition unit combined with analog and digital circuitry is paired with a single board computer that runs the analytics and visualization part using mostly Python and its vast array of modules that achieve just about everything. PyQt widgets along with PyQtGraph handle most of the UIs .

It also tries to reduce the dependence of the target audience on proprietary software by including various free and open source alternatives in fully configured form , thereby facilitating the transition to a FOSS environment.

A real-time data acquisition unit combined with analog and digital circuitry is paired with a single board computer that runs the analytics and visualization part using mostly Python and its vast array of modules that achieve just about everything. PyQt widgets along with PyQtGraph handle most of the UIs .

The feature list for the acquisition and control portion:

  • Several 12-bit Analog inputs with programmable gains, and maximum ranges varying from +/-16V to +/-5mV.
  • Frequency counter tested up to 16 MHz.
  • 4MHz, 4-channel Logic analyzer with 15nS resolution. Independent function calls are available to measure time differences between specified level changes on different digital inputs ( These come in handy for projectile velocity measurement , and a few odd sensors like the DSM01 dust sensor ).
  • 4-channel oscilloscope capable of monitoring the above mentioned analog inputs at maximum of 2 million samples per second. Includes the usual controls such as triggerring, and gain selection. Also leverages Python-Scipy for curve fitting.
  • W1 : 5Hz - 5KHz arbitrary waveform generator. Manual amplitude control up to +/-3Volts
  • W2 : 5Hz - 5KHz arbitrary waveform generator. Amplitude of +/-3Volts. Attenuable via software
  • up to four phase correlated PWM outputs with maximum frequency 32MHz, 15nano second duty cycle, and phase difference control.
  • 12-bit Constant Current source. Maximum current 3.3mA [subject to load resistance]. voltage monitoring must be carried out externally to check for saturation.
  • SPI,I2C,UART outputs that can be configured and controlled entirely through Python functions.
  • Onboard 2.4GHz transceiver for wireless data acquisition. [ The wireless nodes are a drop in replacement for wires connecting I2C/SPI sensors, and also have a 0-3.3V , 10-bit ADC (not calibrated against professional equipment )
  • 5V,3.3V power supply outputs. +/-8V outputs .
  • Graphical Interfaces for Oscilloscope, Logic Analyzer, streaming data, wireless acquisition, and several experiments developed that use a common framework which drastically reduces code required to incorporate control and plotting widgets.
  • In case the user does not wish to use the integrated SBC, a Standalone Mode that uses a 128x64 OLED to display a few basic measurements is also available. It also has space for an ESP-12 module for WiFi access with access point / station mode (Running the JEELabs transparent UART firmware) .
Title Journal Author(s)

SEELablet : A Technological Platform for Development of Innovative Experiments for Undergraduate Education

APT TUNES

Jithin B.P.

Physics Experiments : Example use for commonly available sensors for science labs

Aim : To study the oscillations of a physical pendulum, and observe the relation of its angle to its velocity. Also calculate the value of g, given the length of the pendulum

The picture shows an MPU-6050 (3-Axis accelerometer + 3-Axis Gyroscope ) hooked up to the I2C port via thin guage copper wires designed to cause minimal perturbation to the oscillations of the pendulum.

Pendulum

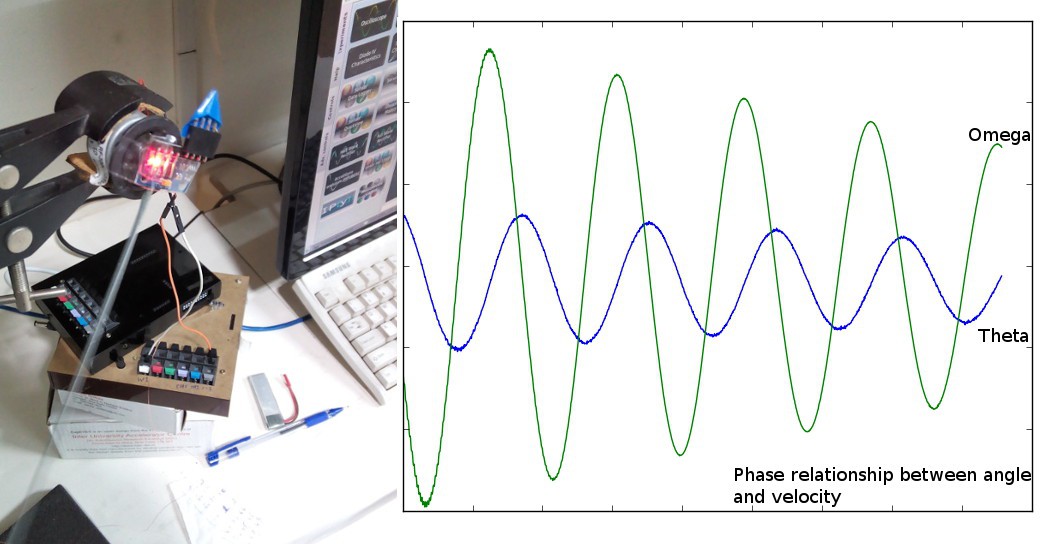
The IC is positioned at the pivot so that the accelerometer can be used to measure the angle of the pendulum accurately using the vertical compoenent of earth’s gravitational pull.The gyroscope’s values for the axis parallel to the pendulum’s pivot are also recorded.

Resultant data

Note that the velocity is maximum at the mean, and zero at the extremities

Electronics Experiments example

Studying a linear amplitude modulator circuit

Amplitude modulation

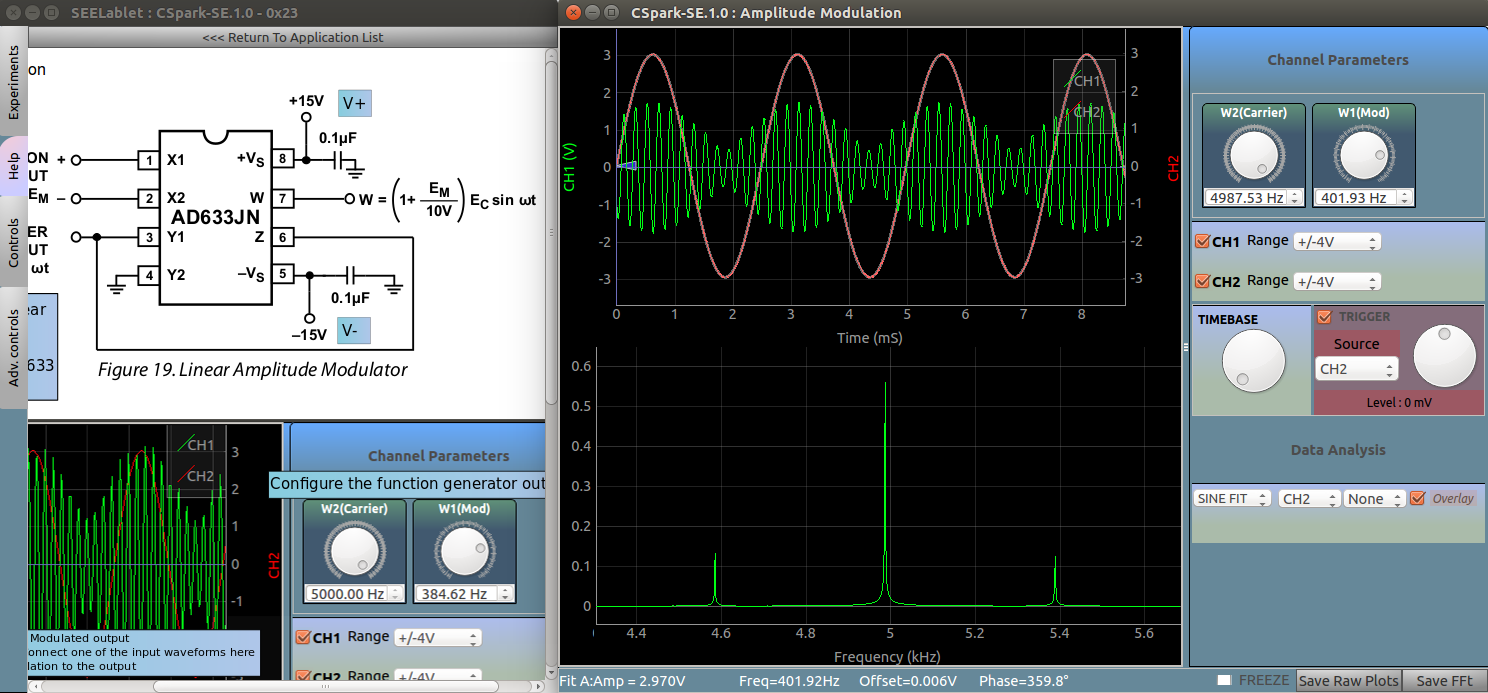
Fourier transform of the modulated output shows a single peak for the carrier, and sidebands with frequencies (carrier +/- modulator ) . Changing the modulation amplitude changes the height of the sidebands. In the figure, CH2 is connected to the modulation input.

Documentation

Each Experiment window involves an HTML based help file ( replacing the traditional hard-bound lab manual ) , and is available for educators to edit as they deem fit.

Resources