Four channel Oscilloscope Window with traces for A1, A2, A3, and MICrophone input. Also includes configuration tools for WG, SQ1, SQ2, PV1, PV2...
July 05, 2019
 Jithin B.P.
 Jithin B.P.
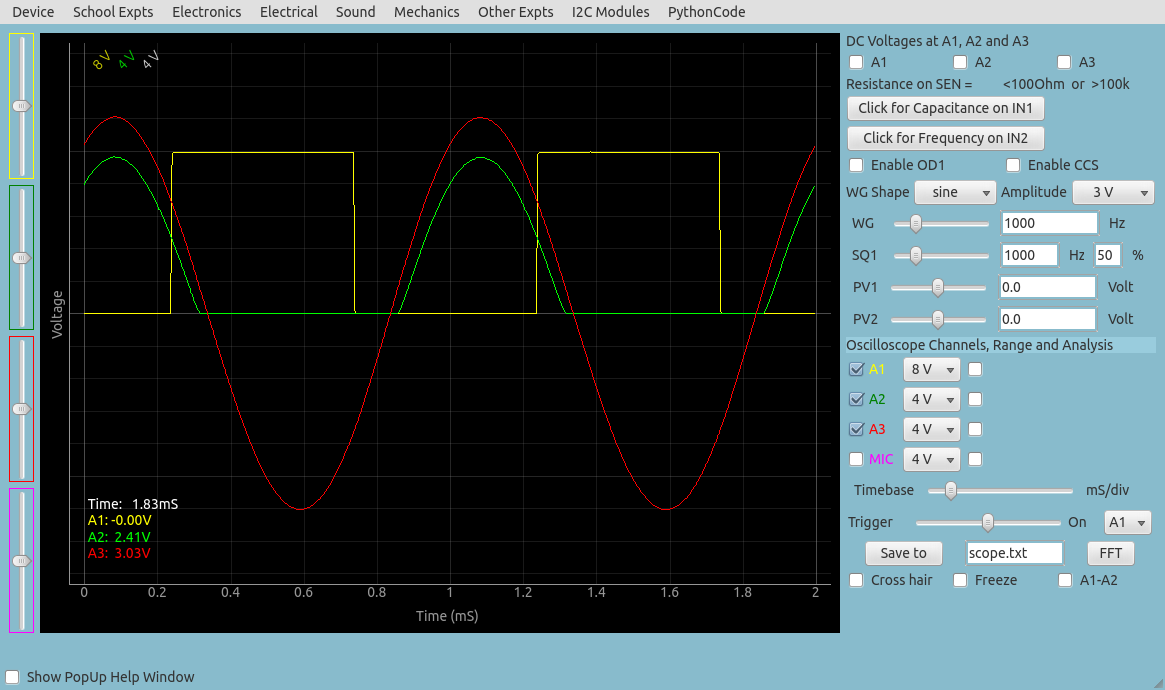
The main GUI of ExpEYES17 resembles a four channel oscilloscope, with additional elements for controlling the function generator, voltage source etc. The screen shot below shows data on three channels. Large number of activities can be performed using the scope GUI, shown below.
Constant Current Source(CSS) : the constant current source can be switched ON and OFF under software control. The nominal value is 1mA but may vary from unit to unit,due to component tolerances. To measure the exact value, connect an ammeter from CSS to GND. Another method is to connect a known resistance(~1K) and measure the voltage drop across it. The load resistor should be less than 3k for this current source.
Programmable Voltage : Can be set,from software, to any value in the -5V to +5V range.The resolution is 12 bits, implies a minimum voltage step of around 2.5 millivolts.
Square Wave Generator SQ1 : Output swings from 0 to 5 volts and frequency can be varied 4Hz to 100kHz. All intermediate values of frequency are not possible. The duty cycle of the output is programmable. Setting frequency to 0Hz will make the output HIGH and setting it to -1 will make it LOW, in both cases the wave generation is disabled. SQR1 output has a 100Ω series resistor inside so that it can drive LEDs directly.
Square Wave Generator SQ2 : Output swings from 0 to 5 volts and frequency can be varied from 4Hz to 100kHz. All intermediate values of frequency are not possible. The duty cycle of the output is programmable. SQR2 is not available when WG is active.
Digital Output (OD1) : The voltage at OD1 can be set to 0 or 5 volts using software.
Sine/Triangular Wave WG : Frequency can be varied from 1Hz to 5kHz. The peak value of the amplitude can be set to 3 volts, 1.65 volts or 150 mV. Shape of the waqveform output is programmable, using the GUI sine or triangular can be selected. WG bar is converted into WG.
Capacitance meter IN1 : Capacitance connected between IN1 and ground can be measured. It works better for low capacitance values, upto 10 nanoFarads but it is possible to measure in micro farad range also.
Frequency Counter IN2: : Capable of measuring frequencies upto several Mega Hertz. Also works as an analog input in the 0 to 3.3 volts range.
Resistive Sensor Input(SEN) : This is mainly for sensors like Light Dependent Resistors,Thermistors,Photo-transistors etc.. SEN is connected to 3.3 volts through a 5.1kΩ resistor.
±16V Analog Inputs, A1 & A2 : Can measure voltage within ±16 volts range. The input voltage range can be selected from .5V to 16V fullscale. Voltage at these terminals can be displayed as a function of time, giving the functionality of a low frequency oscilloscope. The maximum sampling rate is 1Msps/channel. Both have an input impedance of 1MΩ.
±3.3V Analog Input A3 : Can measure voltage within ±3.3 volts range. The input can be amplified by connecting a resistor from Rg to ground, gain -1 + (Rg/10000). The input impedance of A3 is 10MΩ.
Microphone Input MIC : A condenser microphone can be connected to this terminal and the output can be captured.
12C Sensor Interface : The four connections(+5V, Ground,SCL and SDA) of the 8 terminal berg strip supports 12C sensors. The software is capable of recognizing a large variety of I2C sensors for measuring temparature, velocity, acceleration etc.. These are easily available in the market.
+/-6V / 10mA Power Supply : The VR+ and VR- are regulated power outputs. However,they can supply very little current, but good enough to power an Op-Amp.
Connect PV1 to A1, change PV1 using slider and watch A1 changing. Try with PV2 & A2
Connect different capacitors between IN1 to Ground and measure them.
Measure Resistors (Accuracy is less for values < 100 Ohm and > 100 kOhm)
Connect SQ1 to IN2 and measure the frequency. Change it using slider and measure again.
Connect 1000 Ohms from CCS (1.1mA) to ground, Connect CCS to A1. Enable CCS and note the voltage The inputs A1, A2, A3 and the resistance connected to SEN are measured and displayed every second. But these readings are meaningless when AC inputs are connected, because the instantaneous value will continuously vary.
For sinusoidal AC inputs, enable the Check-Button in front of the channel widget. This will fit the waveform against a standard sine function ( Amplitudesine(frequencyt) ) , and display amplitude, frequency