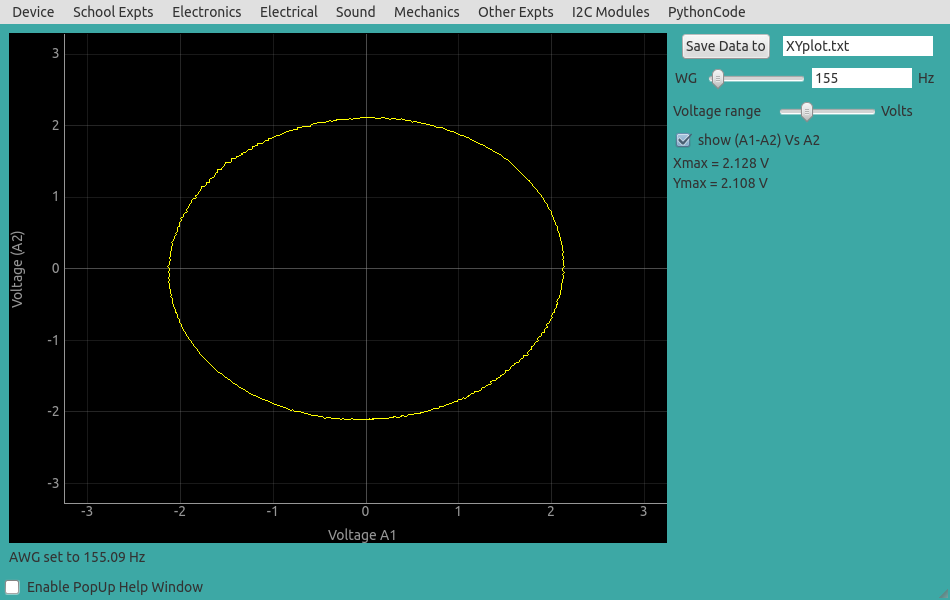
Input and output waveforms of phase shifting circuits are plotted along orthogonal axes to obtain lissajous figures. At 90 degree phase shift, the normalized lissajous figure is circular.
May 02, 2019
 Jithin B.P.
 Jithin B.P.
A sinusoidal voltage is applied to a series RC circuit and the voltages across R and C are plotted. The resulting trace becomes a circle when R = Zc. The frequency is varied until the condition Xmax = Ymax is met.

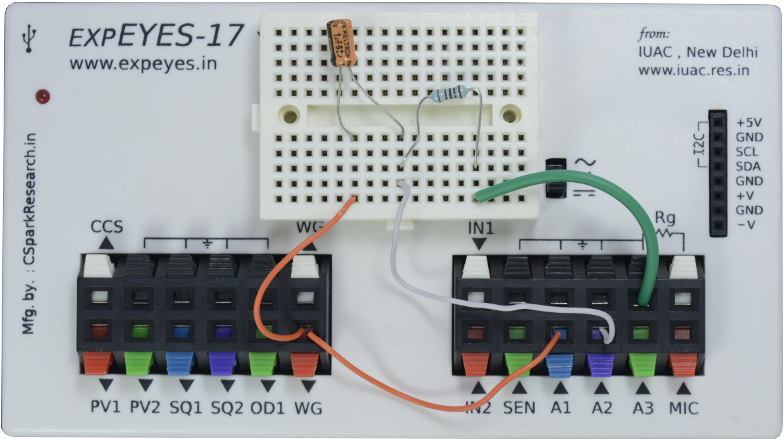
The phase shift to be calculated is that between the drop across the resistor R, and the capacitor C. However, our measurements are with respect to ground(GND), and therefore, while A2 measures the drop between R and Ground as required, A1 is measuring the voltage across R+C .
Since we need the drop across the capacitor C, it suffices to subtract A2(R) from A1(R+C) . This is done by the Python code, and we plot A2(R) vs (A1-A2) .
When the shape becomes circular, ZC will equal R . Confirm this from the values you used.