Introduction
- Every mechanical object has a mechanical resonance frequency, decided by its dimensions and elasticity proprties. The resonance frequency of the Piezo disc supplied with ExpEYES is around 3500 Hz, and will vary from unit to unit.
- Applying an oscillating electrical signal makes the Piezo disc to oscillate with it and generate a sound.
- The amplitude of these oscillations is maximum when the driving frequency is equal to the resonance frequency, and the sound is loudest.
The goal of this experiment is to study the loudness at various frequencies, and thereby obtain the frequency response of the piezo.
The oscilloscope monitors two signals:
- the wave driving the Piezo. WG is connected to A1.
- and the signal detected by the microphone.
The amplitude is measured with good precision by fitting the measured waveform from the MICrophone against a sine function.

The microphone is used to digitize this new sound, in order to see what the signal looks like.
Screenshot
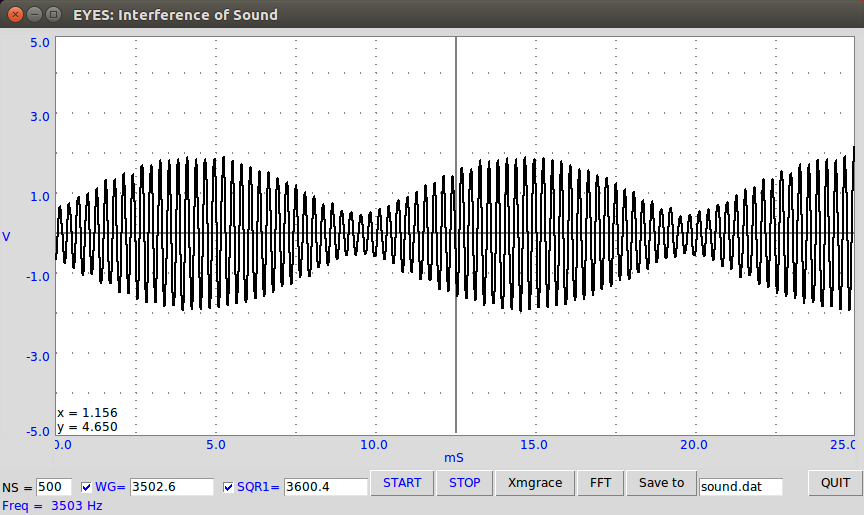
You can observe that the higher frequency now has an oscillating envelope. The frequency of this envelope can
be calculated by measuring the time between each node, and taking the reciprocal.
e.g : If two nodes are formed at 10mS, and 20mS positions, the time period of the beat is 10mS. This corresponds to
a frequency of 100Hz !
The resonance frequecy of the Piezo disc supplied with ExpEYES is around 3500 Hz. It could vary from unit to unit,
so as you move away from that frequency, the loudness will also decrease.
A fourier transform of this signal reveals the frequencies of the initial components which were used to create it.
Procedure
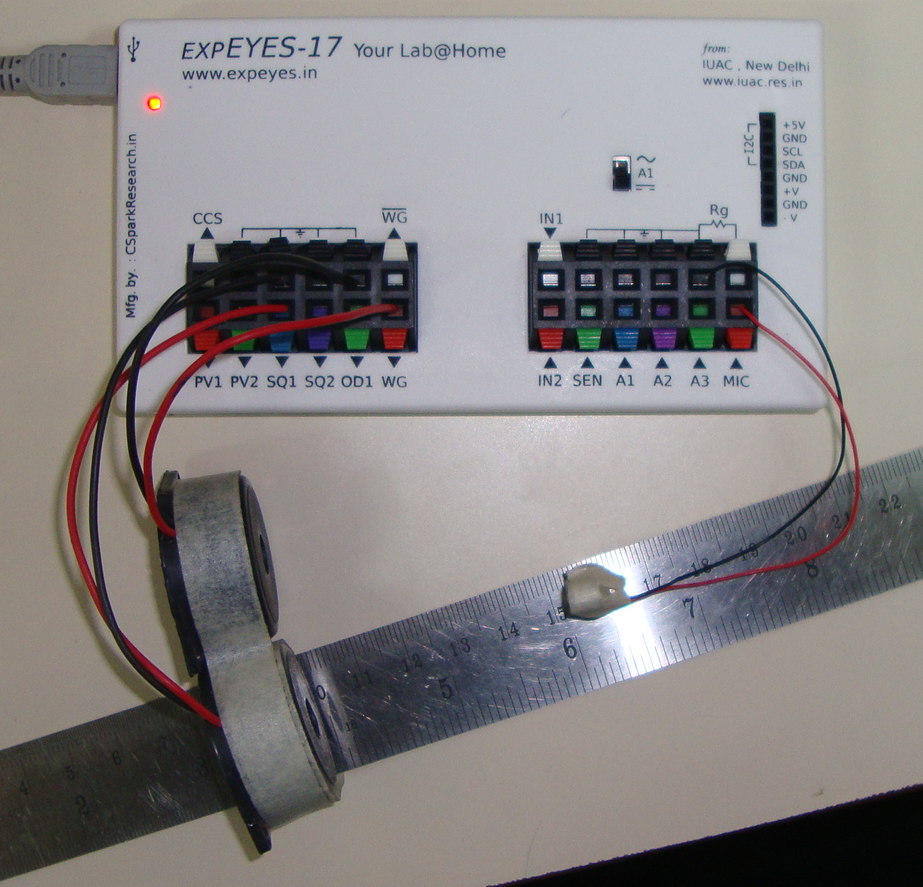
- Connect one piezo to WG, and another to SQ1, and place them as shown in the photograph.
- Fix the mic facing the buzzer, 4 to5 cm away from the two piezo.
- Select the frequency range over which you need to study the response
- Press the START button, and watch as the amplitude reaches a maximum value centered around the resonance.
- The amplitude of the microphone output is plotted as a function of frequency, and tells you the operating range for the piezo
Exercises:
- Use different values for SQ1 , and WG , and measure the time period. Is it equal to the time period of SQ1-WG?
- Stick a small piece of tape, or a drop of glue on the piezo disk, and repeat the experiment. Is there a change in the resonant frequency?
 Jithin B.P.