Data logging from sensors
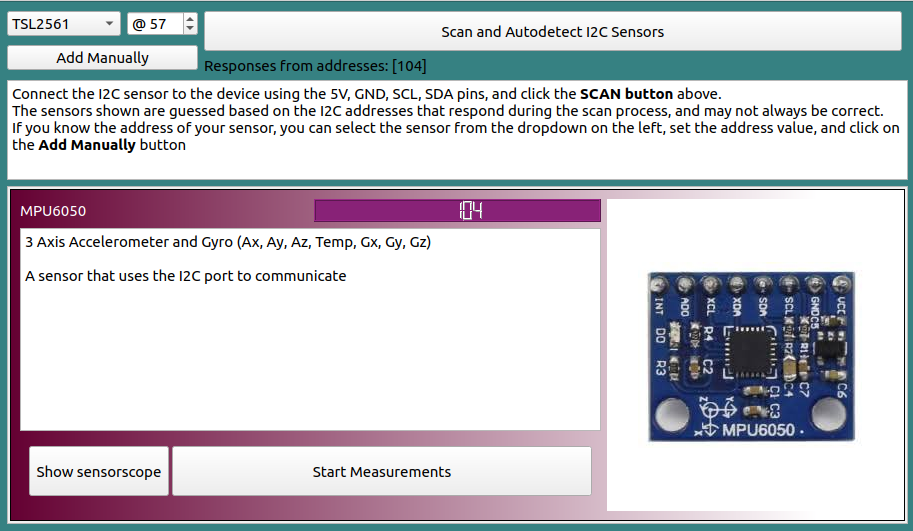
In the pictures below, you can see the main screen of the I2C Logger. When you click the scan button, any connected sensors are listed, and options are shown to record
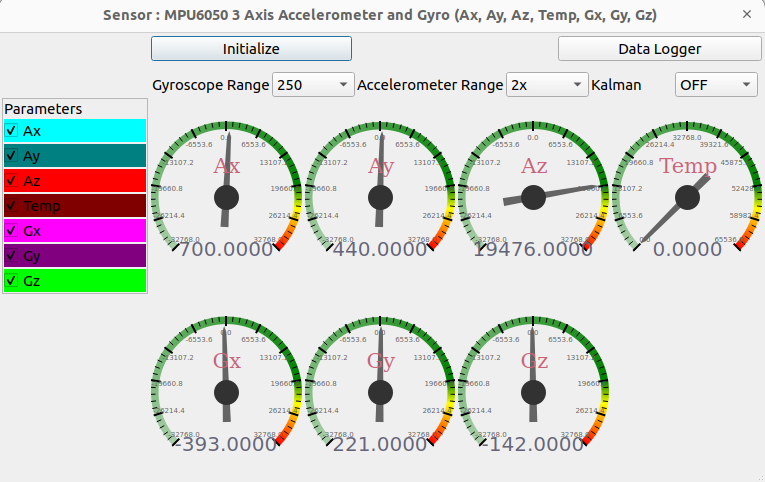
data from them. The MPU6050 is detected, and clicking the Start Measurements button launches a series of gauges displaying information from the available parameters
of that sensor, namely, 3 axis acceleration and 3 axis angular velocity
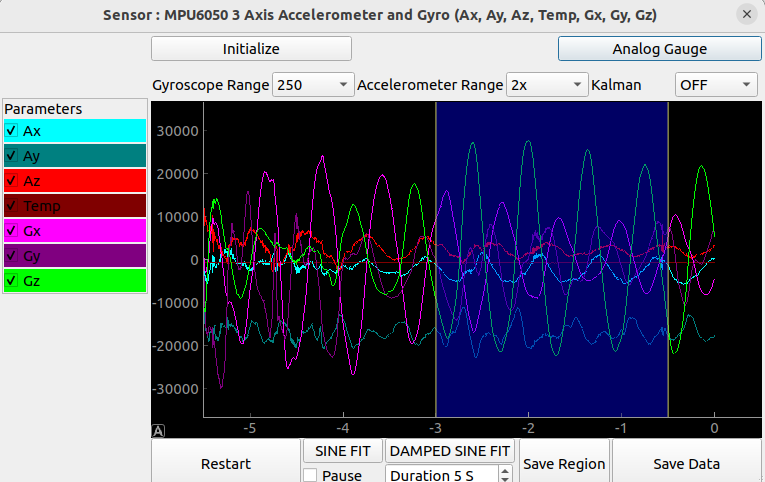
Clicking the datalogger button at the top right corner switches to a graph view where everything is plotted against time, and you can do basic analysis such as sine fitting.
However, each set of readings can take up to 10mS due to communication delays, and OS scheduler issues. Essentially, if your PC slows down due to other programs, the
timestamps will also suffer.
Data logging using the sensor oscilloscope.
The SEELab3 device has the ability to take up to 8000 readings from sensors connected via the I2C bus with microsecond accuracy similar to the oscilloscope.
This enables high speed readings with no OS delays causing timestamp errors. Fourier transform enables vibration analysis of mechanical devices.
In this post, we’ll discuss how to use the sensor oscilloscope function to perform vibrational analysis on a floor fan, and extract its frequency using fourier transforms.
Testing the sensor [SENSOR SCOPE]
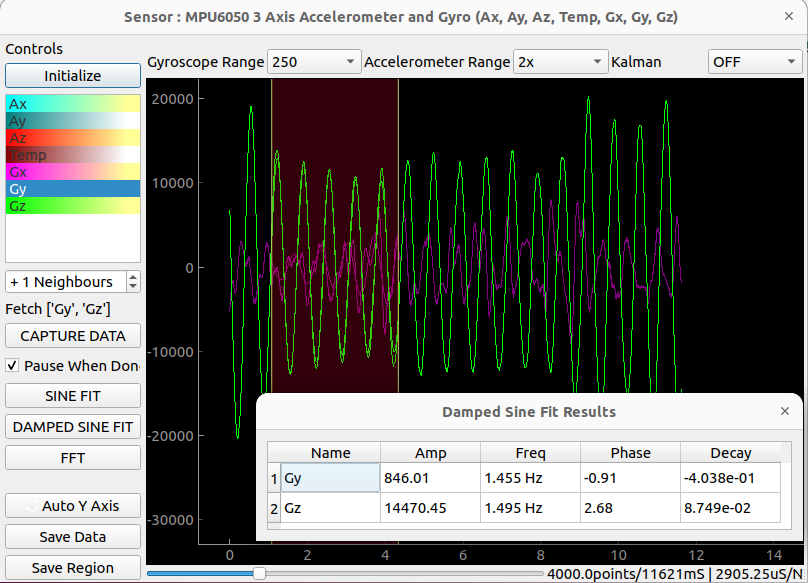
To test things, the scope was set to record 4000 datapoints from Gy and Gz over a 11 second period. This is done by Selecting Gy on the list on the left, and setting the neighbours box to +1 .
I physically oscillated the sensor, and then used sine fit to extract the oscillation frequency. A datapoint is recorded every 2905.25 microseconds precisely.
Recording the Pedestal Fan
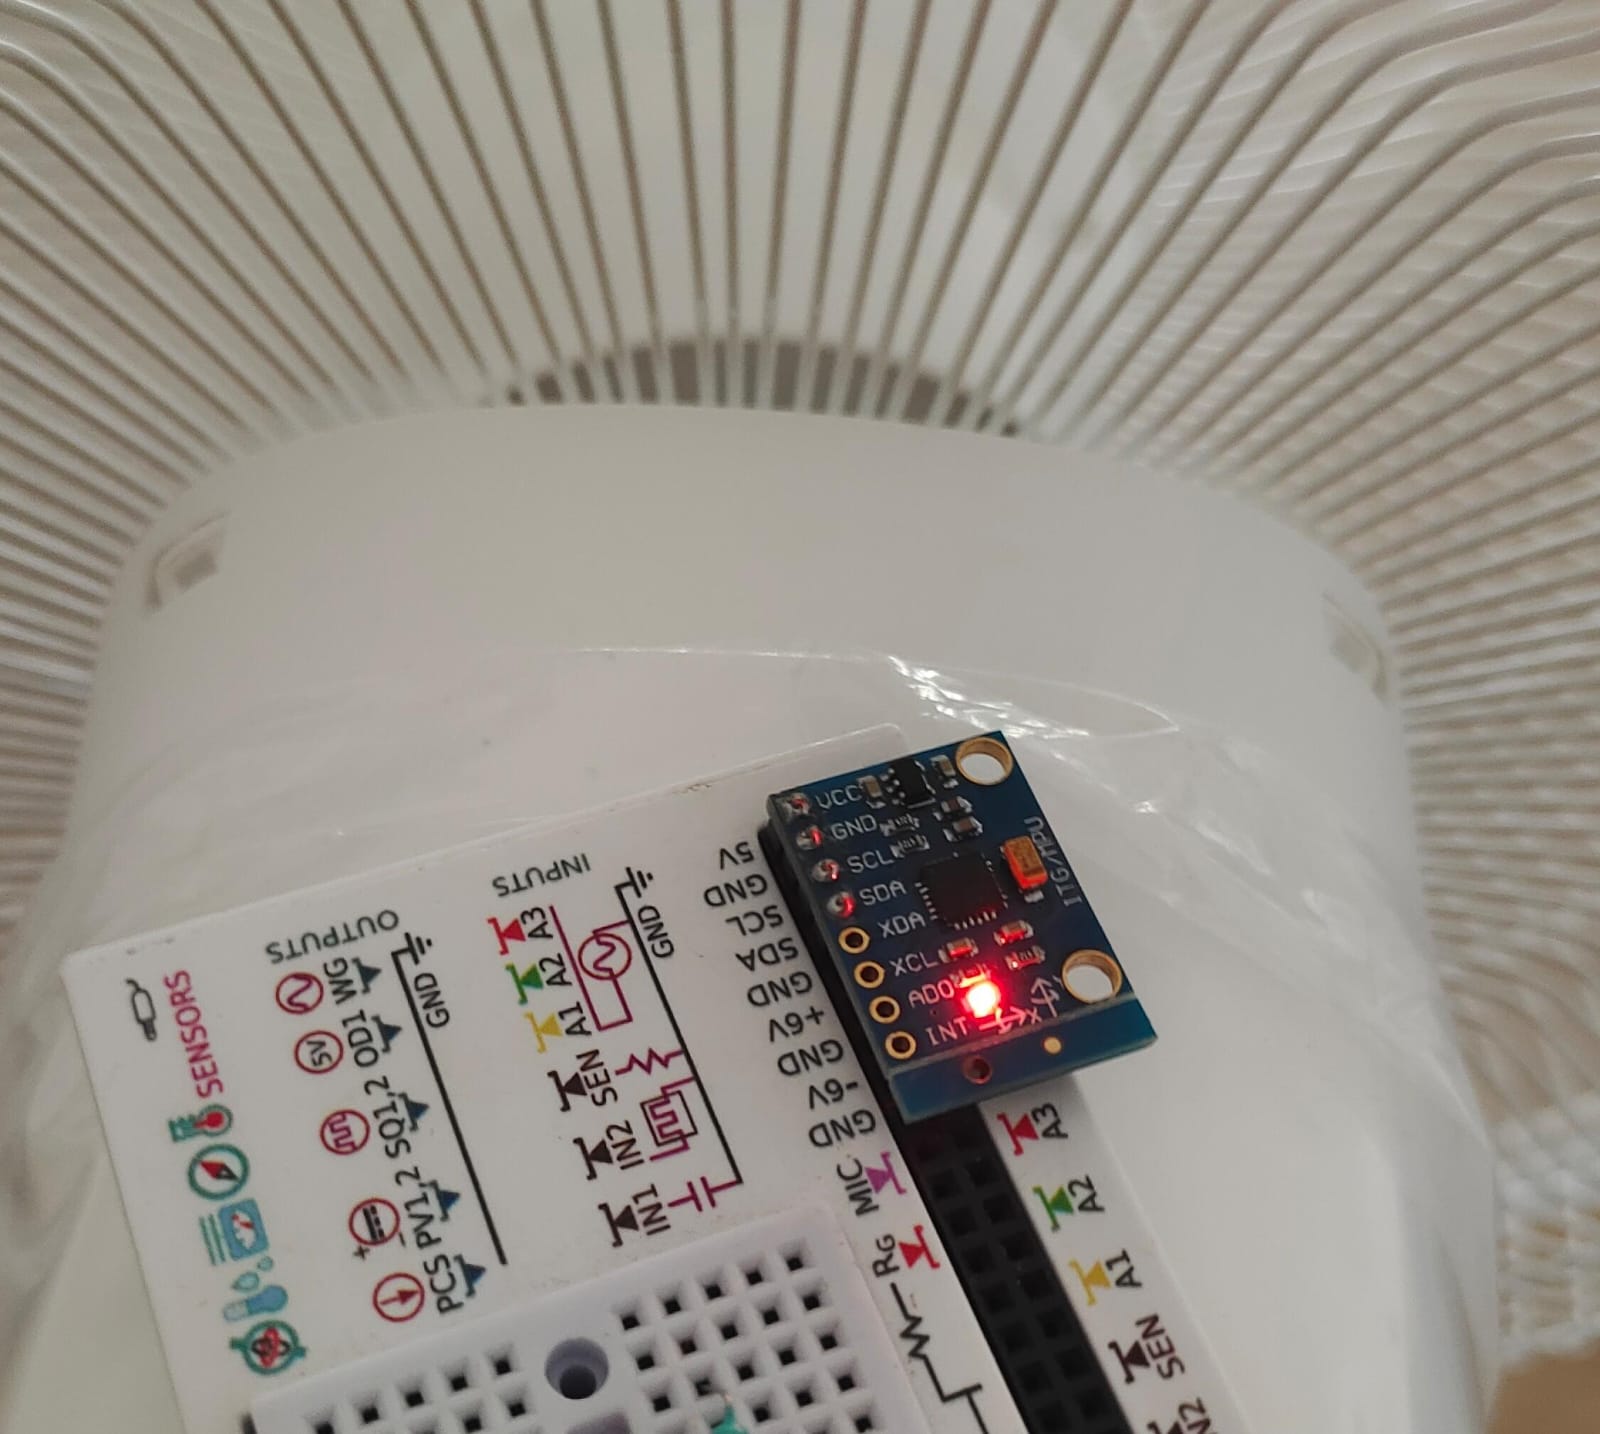
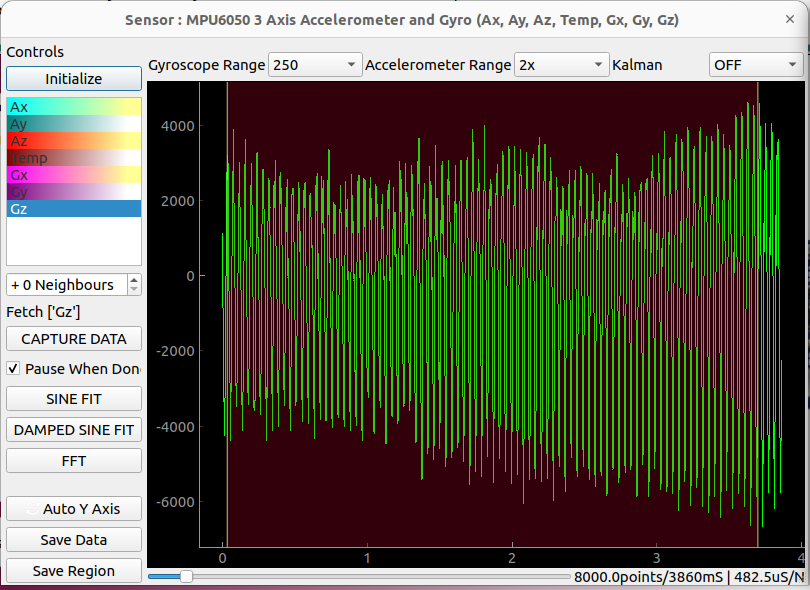
The MPU6050 6 axis Inertial Measurement sensor was connected to the SEELab3 device and clamped onto the body of a pedestal fan. It is easy to feel the vibrations
using your hand, but we would like to record them as a function of time using the sensor. The selected parameter is Gz which is angular velocity around the Z axis.
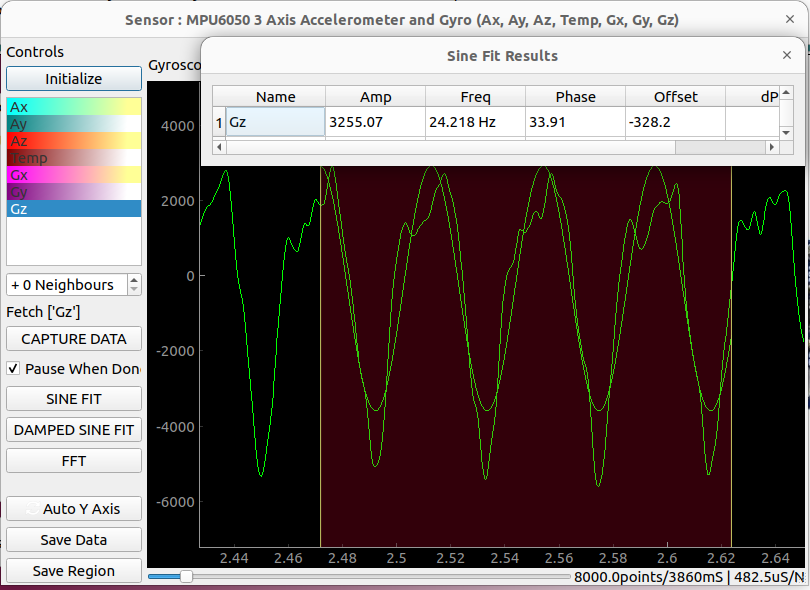
8000 points from Gz were taken with a 482.5uS interval. This gives a total of 3.86 seconds of data. It was
zoomed in, and a regular sine fit was used to estimate the oscillation frequency. 24.2Hz was seen.
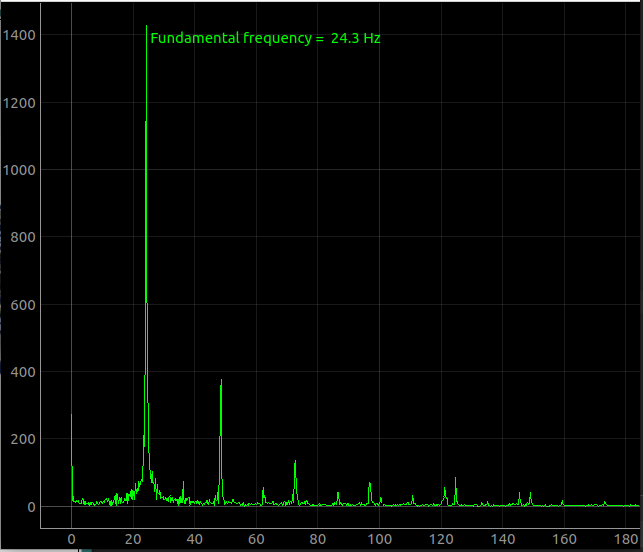
The above raw data was then fourier transformed to reveal a fundamental frequency of 24.3Hz and many smaller peaks representing other vibrations
Applications
This opens up several possibilities in the field of engineering. E.g., if a car is mounted on a platform such that the wheels can freely rotate,
the FFT will include many peaks representing the various rotating parts inside the car. The flywheel connected to the engine might have some
speed, the vibrations of each cylinder will have higher speeds, and other gears and wheel connected to the engine may have lower speeds.
From this data, it should be possible to identify faulty parts, because a significant peak in the FFT spectrum represents a wildly oscillating body. A smoothly rotating
part with no asymmetry will show a negligible, or no peak at all.
 Jithin B.P.