Distance Measurement using Sound
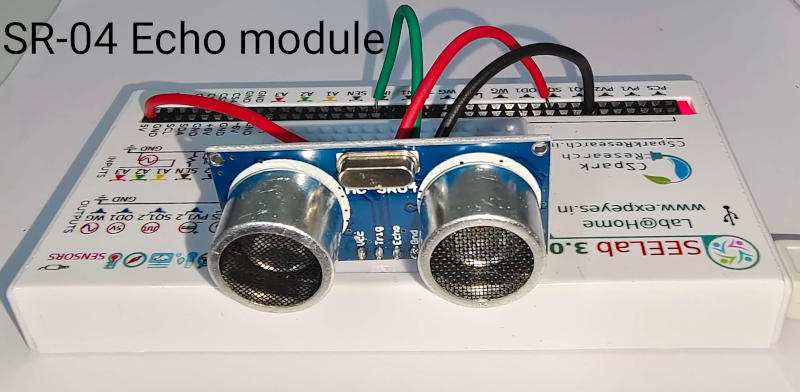
HY-SR04 is a widely available ultrasound ranging module. It consists of two 40 kHz Piezo crystals, one acts as a transmitter and other as a receiver.
A sound pulse is emitted, and the time interval between this burst of sound and the echo received is measured using ExpEYES/SEELab.
The four pins are the power supply, ground, trigger and Echo. This module can be connected to ExpEYES-17 as shown in the instructions, to measure distance between the module and the reflecting surface, with an error around 3mm.

The interactive schematic
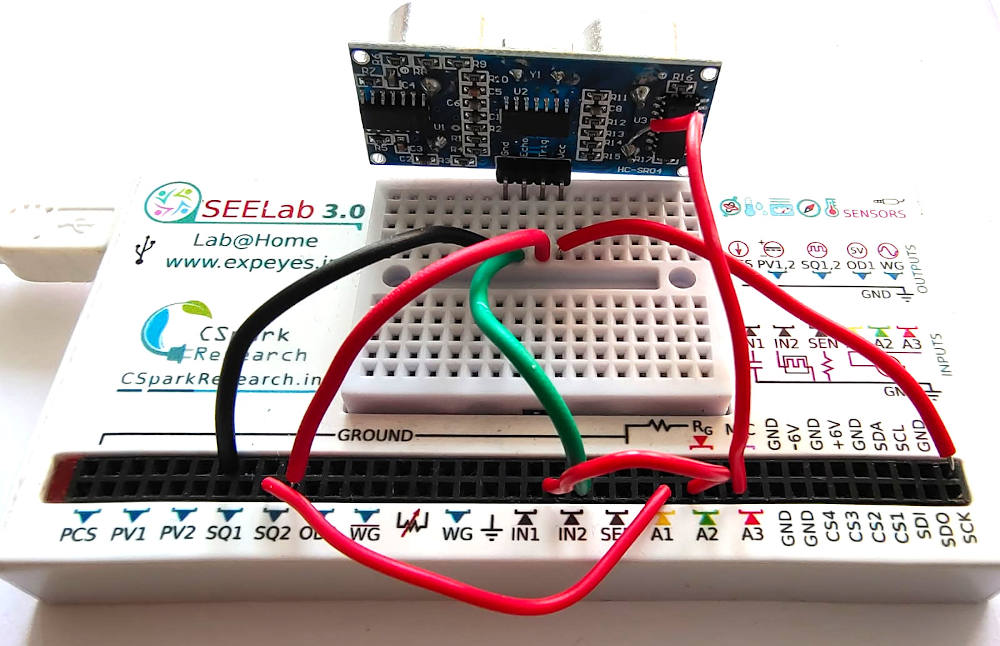
The connections are made as follows
- 5V to 5V of the module
- GND to GND
- SQ2 - this emits a short pulse to instruct the module to start a measurement. It is connected to TRIG (Trigger)
- IN2 - The module responds with a voltage signal that goes up(5V) as soon as the pulse is emitted, and comes back to 0V when the reflected sound(echo) is received. If not received, it goes down to zero after a short timeout interval. Connect this to IN2 which can measure time intervals
The data is shown in a block, and is also plotted. A flat oscillating object was used to record the data shown in the video recording below.
Further understanding of how this works
We need to monitor the signals exchanged with this sensor
We further connect
- SQ2(TRIG) -> A1
- IN2(ECHO) -> A2
- A microphone placed between the two piezos on the SR04 module -> MIC . This is try to pick up both signals since they are at 40kHz, and we can’t hear them.
And select the appropriate graph from the menu.
The following graphs were obtained
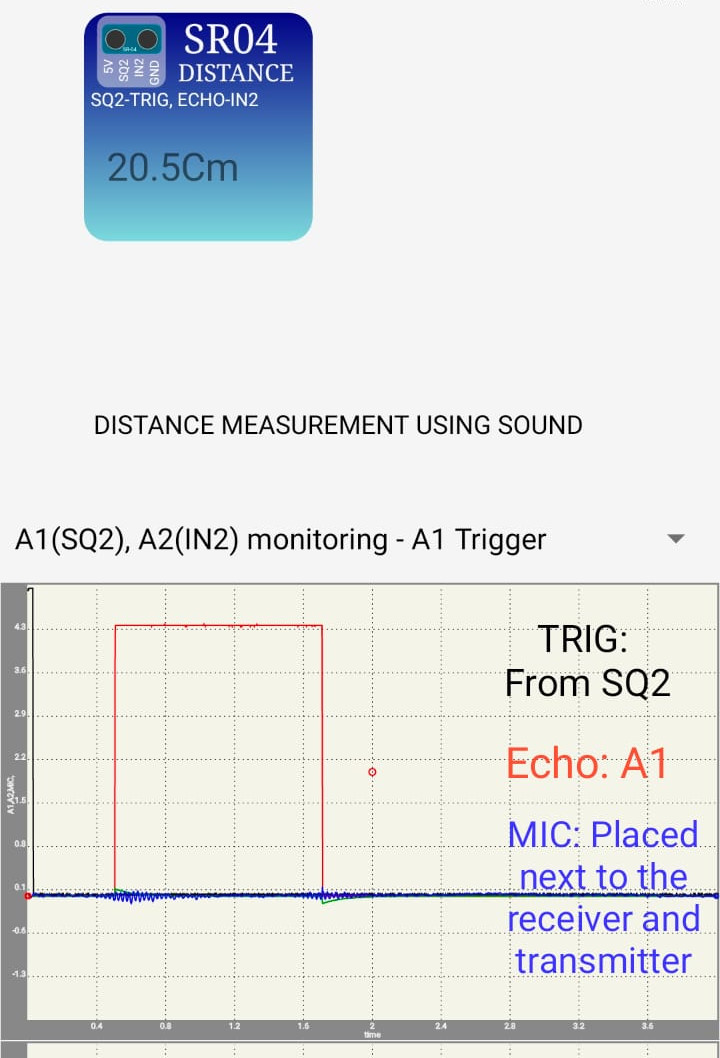 You can see a small ripple picked up by the microphone when the module transmits, and another smaller one when the echo is received. You can observe that these coincide
with the red graph(Echo) .
You can see a small ripple picked up by the microphone when the module transmits, and another smaller one when the echo is received. You can observe that these coincide
with the red graph(Echo) .
We shall now try to directly monitor the voltage supplied to the transmitter, and compare with the red graph.
For monitoring the signals, we connect instead of a microphone
- Pin of the piezo transmitter -> A3
The following graphs were obtained
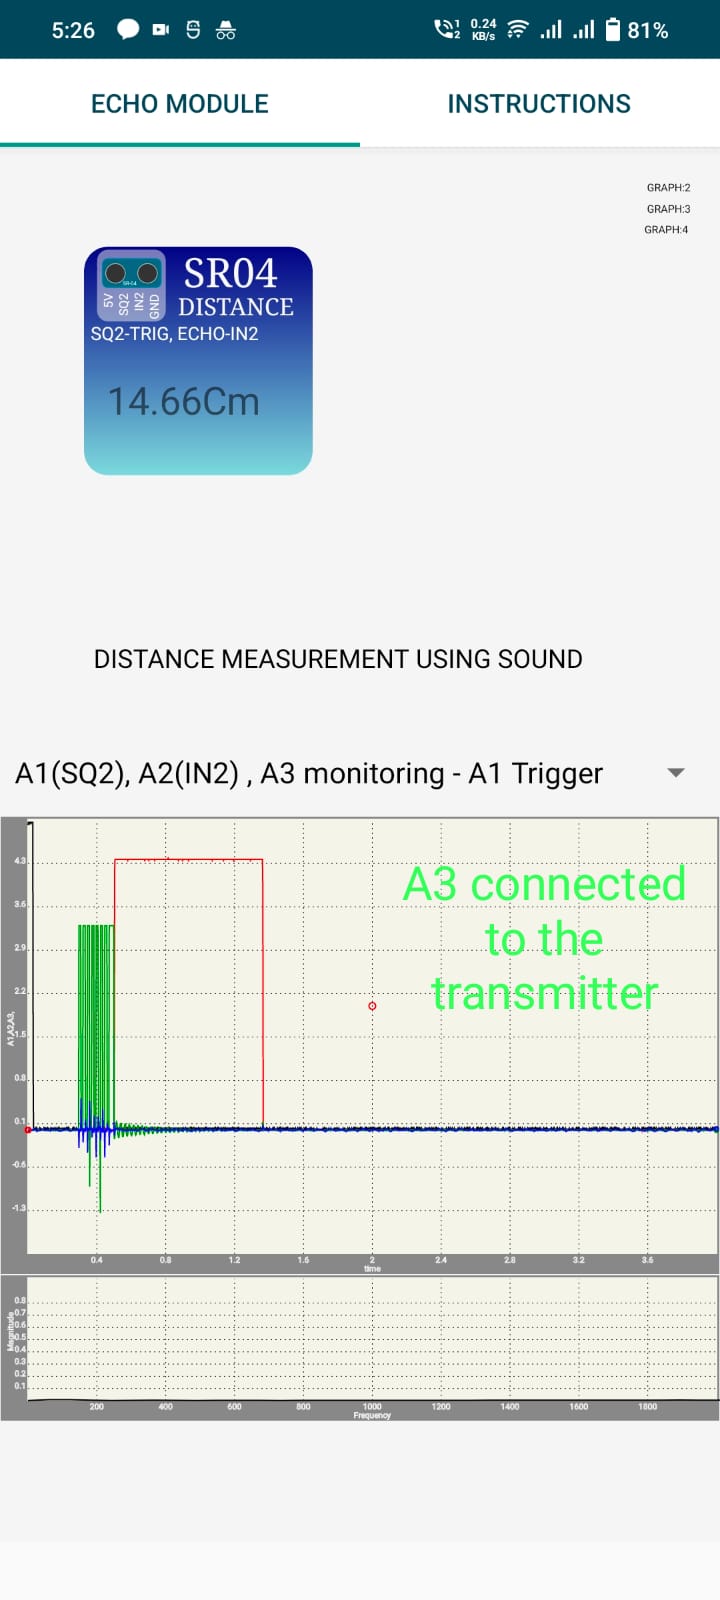
You can see that the piezo receives 8 oscillations, and after that the red graph goes up to 5V indicating that the sound pulse has been sent!!
It returns to 0 on either timeout, or if the receiver which is tuned to the same frequency as the transmitter gets the echoed signal.
Since speed of sound is known (Around 340m/s) , Distance = Speed/time taken. Since time is measured for the round trip of the sound pulse , distance to the reflecting object is only
half of this calculated distance. So,
Distance = 340/time/2
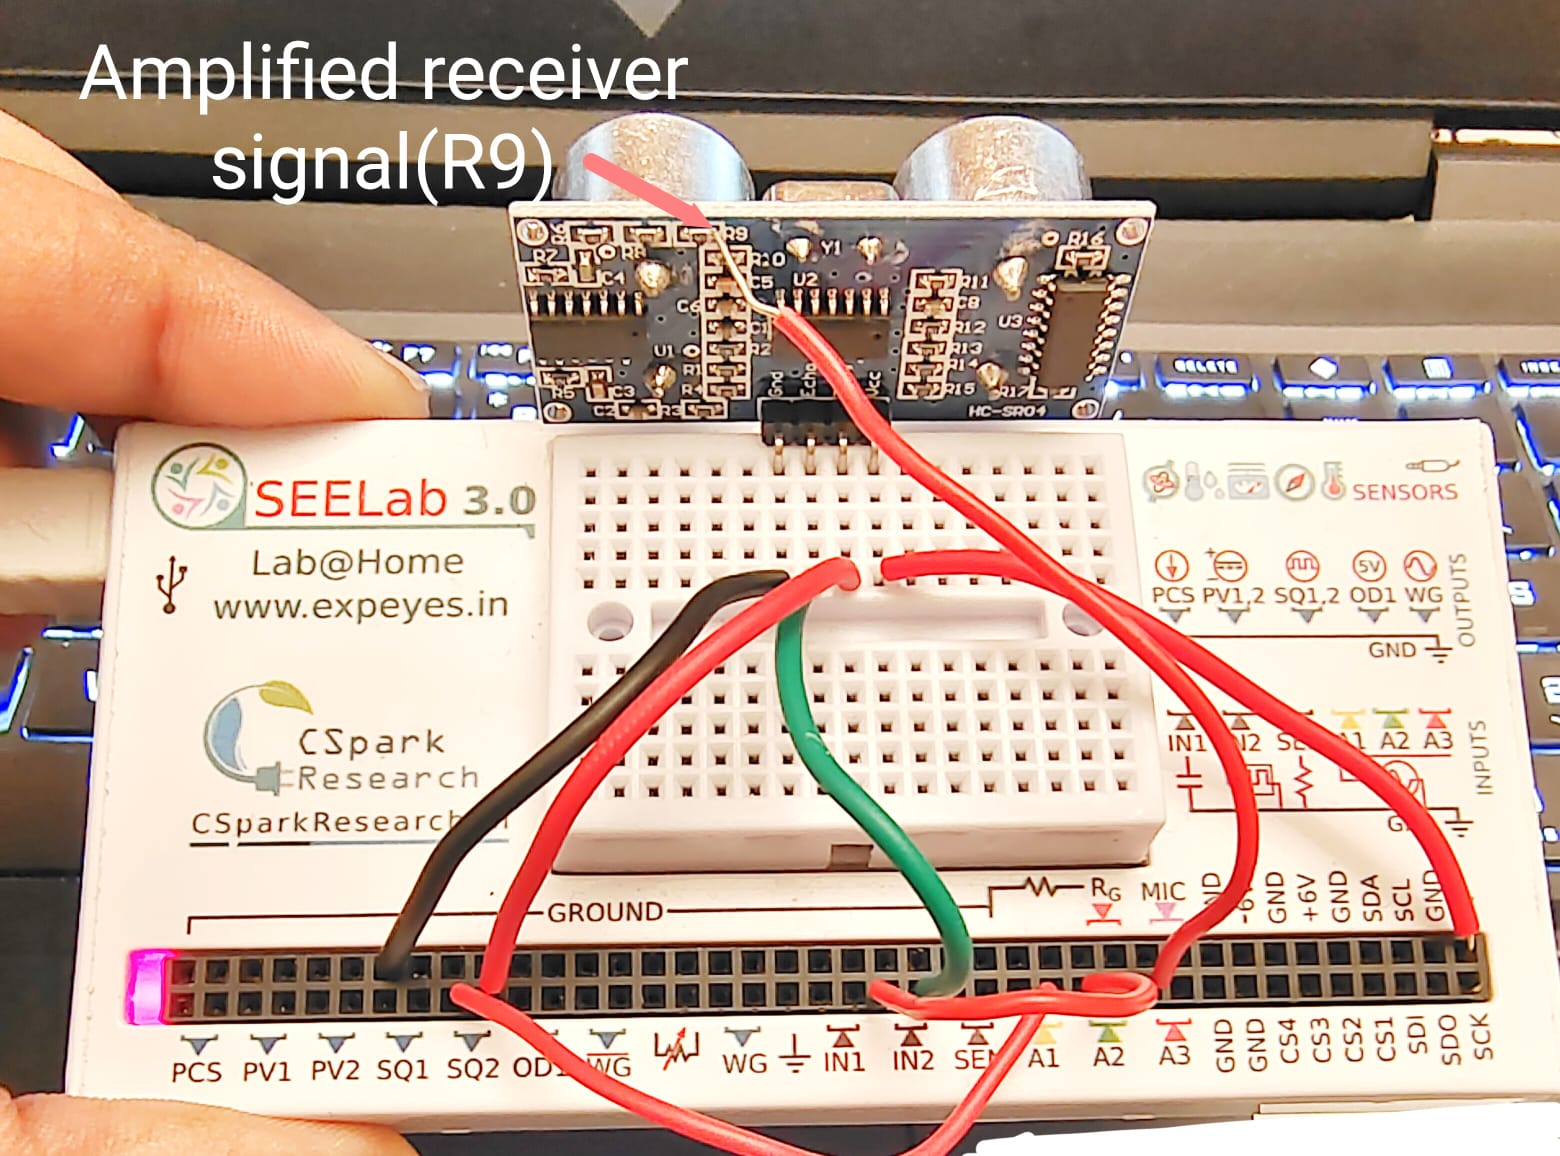
We can also directly monitor the amplified receiver signal.
After some trial error, this signal was available at resistor R9. So we connected A3 to that as shown below
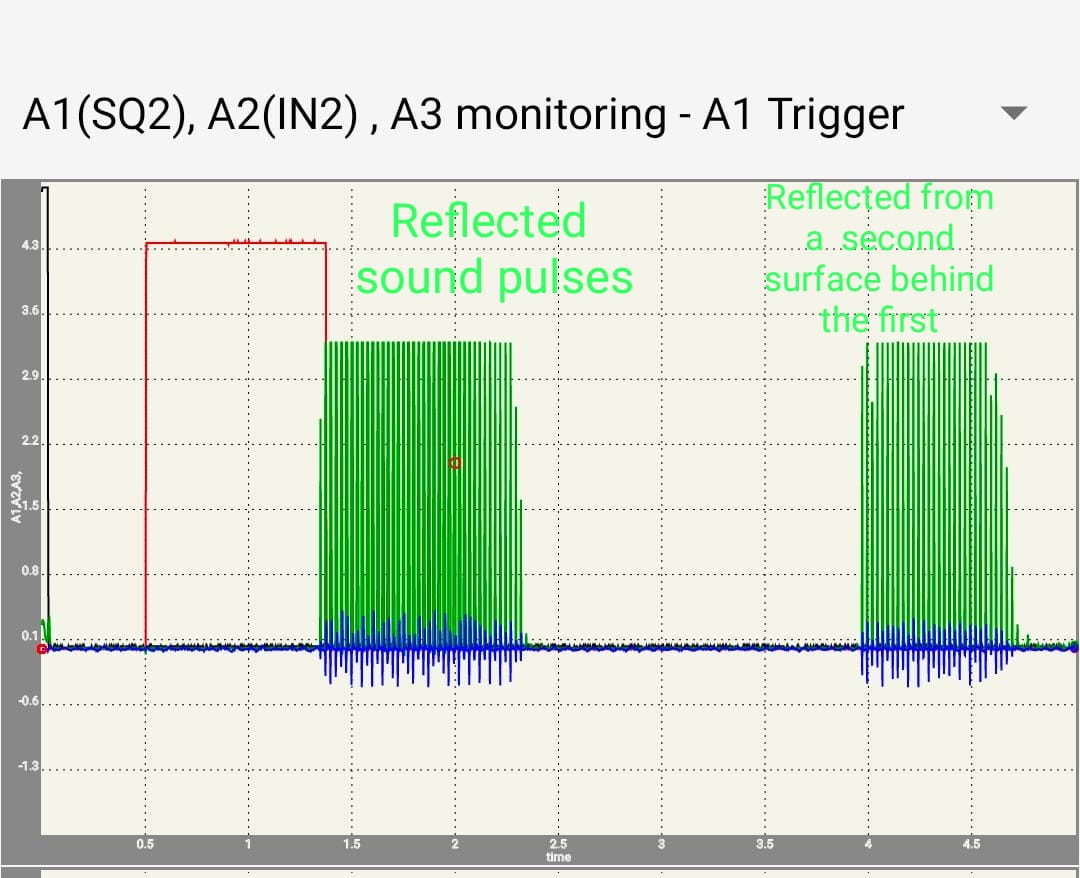
The receiver pulses(Green) coincide with the Echo signal(Red) going low . We can also see a second set of receiver pulses because a second reflecting object was placed behind
the first. So basically the same transmitted sound bounced from two different surfaces, with one taking more time than the other.
This can be used to design several experiments in mechanics.
The Mass and Spring problem
When a mass suspended on a spring is made to oscillate, the period of oscillation is given by T = 2 * pi * sqrt( m/k), where m is the mass and k is the spring constant. We can measure the period of oscillation by measuring the distance to the moving mass as a function of time. The distance versus time graph is fitted with a sine function to calculate the frequency. The photograph below shows a metal plate suspended on a spring and the SR04 facing it from the bottom. The distance to the oscillating plate is measured for 5 seconds and the data is fitted to a sine function.

A video of the experiment is HERE
Simple Pendulum
The period of oscillations of a pendulum also can be measured using SR04 connected to ExpEYES. The figure shows a pendulum with a rectangular bob, but one can use a spherical bob with a piece of paper (to provide a flat reflecting surface) pasted to it. The measured frequency is 1.05 Hz for a pendulum having a length of 22cm. One can calculate the value of acceleration due to gravity from this data.
Video
Free Fall, Displacement as a function of Time
It is possible to measure the distance to a body falling under gravity. The value of ‘g’ can be calculated by fitting the data with the polynomial
S(t)= a * t^2 + b * t + c
‘g’ is given by 2*a
See Also
 Jithin B.P.